11 Analyzing and editing images
11.1 General
- Adding measurement tools.
- Adjusting the infrared image.
- Changing the color distribution.
- Changing the color palette.
- Changing the image modes.
- Working with color alarms and isotherms.
- Changing the measurement parameters.
11.2 Starting the Image Editor
11.2.1 Starting the Image Editor from the FLIR Report Studio wizard
Follow this procedure:
Do one of the following:
- In the center pane, double-click an image.
- In the right pane, double-click an image.
11.2.2 Starting the Image Editor from the FLIR Word Add-in
Follow this procedure:
Do one of the following:
- Double-click an image in the report.
- Select an image and click Image Editor on the FLIR tab.
- Right-click an image and select Edit Image.
11.3 Image Editor screen elements
11.3.1 Figure
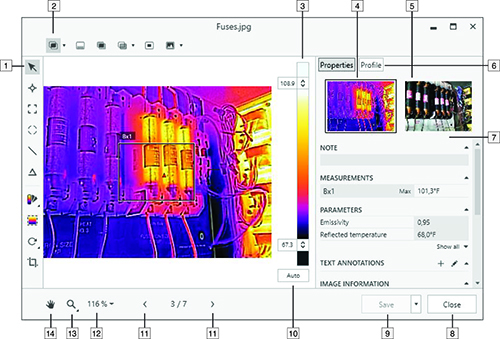
11.3.2 Explanation
- Measurement toolbar.
- Image mode toolbar.
- Temperature scale.
- Thumbnail view of the infrared image.
- Thumbnail view of the digital photo (if available).
-
Results and information tabs:
- Properties.
- Profile.
-
Results and information pane (Properties tab):
- Note.
- Measurements.
- Parameters.
- Annotations.
- Image information.
- Close button.
- Save button.
- Auto-adjust button.
- Navigation buttons. Click the buttons to go to the previous/next image.
- Zoom setting button. Click the button and select one of the predefined zoom settings.
- Zoom button. Click the button to display the zoom-in and zoom-out buttons.
- Pan button. Click the button and then drag the image to pan a zoomed-in image.
11.4 Basic image editing functions
11.4.1 Rotating the image
Follow this procedure:
On the measurement toolbar, select
(Rotate image and measurements). This displays a toolbar.
On the toolbar, do one of the following:
-
Click
to rotate the image counter-clockwise.
-
Click
to rotate the image clockwise.
11.4.2 Cropping the image
Follow this procedure:
On the measurement toolbar, select
(Crop). This displays a box on the image.
Select the crop region by moving and adjusting the size of the box.
In the crop region box, do one of the following:
-
Click
to crop the image. This opens the Save as dialog box.
-
Click
to cancel the crop action.
11.5 Working with measurement tools
11.5.1 General
11.5.2 Adding a measurement tool
Follow this procedure:
On the measurement toolbar, select one of the following:
-
Select
(Add spot) to add a spot.
-
Select
(Add box) to add a box.
-
Select
(Add ellipse) to add a ellipse.
-
Select
(Add line) to add a line.
Click the location on the image where the measurement tool is to be placed.
11.5.3 Moving and resizing a measurement tool
Follow this procedure:
On the measurement toolbar, select
(Selection).
To move a measurement tool, select the tool on the image and drag it to a new position.
To resize a measurement tool, select the tool on the image and use the selection tool to drag the handles that are displayed around the frame of the tool.
11.5.4 Displaying a profile plot
11.5.4.1 General
11.5.4.2 Procedure
Follow this procedure:
Add one or several line tools to the image, see section 11.5.2 Adding a measurement tool .
Click the Profile tab. This displays the profile plot in the right pane.
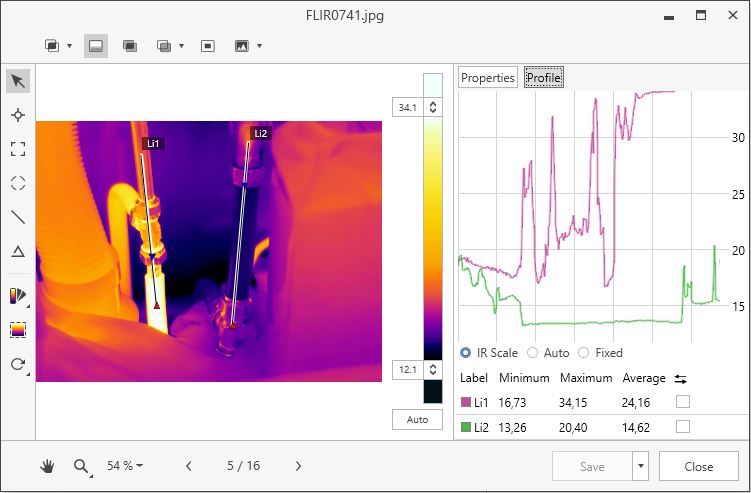
In the right pane, you can select the following types of temperature scales for the plot:
- IR Scale: Uses the same temperature scale as in the image.
- Auto: Uses the minimum and maximum measured temperatures of the line as the minimum and maximum values for the temperature scale.
- Fixed: Uses manually entered minimum and maximum values for the temperature scale.
In the right pane, select the
check box to reverse the start and end points of the line.
11.5.5 Creating local markers for a measurement tool
11.5.5.1 General
11.5.5.2 Procedure
Follow this procedure:
On the measurement toolbar, select
(Selection).
Right-click the tool and select Local max/min/avg markers.
In the dialog box, select or clear the markers you want to add or remove.
Click OK.
11.5.6 Calculating areas
11.5.6.1 General
11.5.6.1.1 Procedure
Follow this procedure:
Add a box or circle measurement tool, see section 11.5.2 Adding a measurement tool .
Adjust the size of the box or circle tool to the size of the object, see section 11.5.3 Moving and resizing a measurement tool .
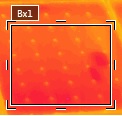
Right-click the tool and select Local max/min/avg markers. In the dialog box, select the Area check box. This displays the calculated area, based on the distance value, in the MEASUREMENTS pane.
To change the distance value, click the value field in the PARAMETERS pane, type a new value and press Enter. The recalculated area, based on the new distance value, is displayed in the MEASUREMENTS pane.
11.5.6.1.2 Calculating lengths
11.5.6.1.2.1 General
11.5.6.1.2.1.1 Procedure
Follow this procedure:
Add a line measurement tool, see section 11.5.2 Adding a measurement tool .
Adjust the size of the line tool to the size of the object, see section 11.5.3 Moving and resizing a measurement tool .
Right-click the tool and select Local max/min/avg markers. In the dialog box, select the Length check box. This displays the calculated length, based on the distance value, in the MEASUREMENTS pane.
To change the distance value, click the value field in the PARAMETERS pane, type a new value and press Enter. The recalculated area, based on the new distance value, is displayed in the MEASUREMENTS pane.
11.5.7 Setting up a difference calculation
11.5.7.1 General
11.5.7.2 Procedure
11.5.7.2.1 Procedure
Follow this procedure:
On the measurement toolbar, select
(Add delta).
The difference calculation is displayed under MEASUREMENTS in the right pane.

To change the setup for the difference calculation, do the following:
-
In the right pane, click
(Edit). This displays a dialog box.
-
In the dialog box, select the measurement tools and what values (maximum, minimum, or average) you want to use in the difference
calculation. You can also select a fixed-temperature reference.
To delete the difference calculation, click
(Delete).
11.5.8 Deleting a measurement tool
Follow this procedure:
On the measurement toolbar, select
(Selection).
Select the measurement tool on the image and do one of the following:
- Press the Delete key on your keyboard.
- Right-click the tool and select Delete.
11.6 Adjusting the infrared image
11.6.1 General
11.6.2 Example 1
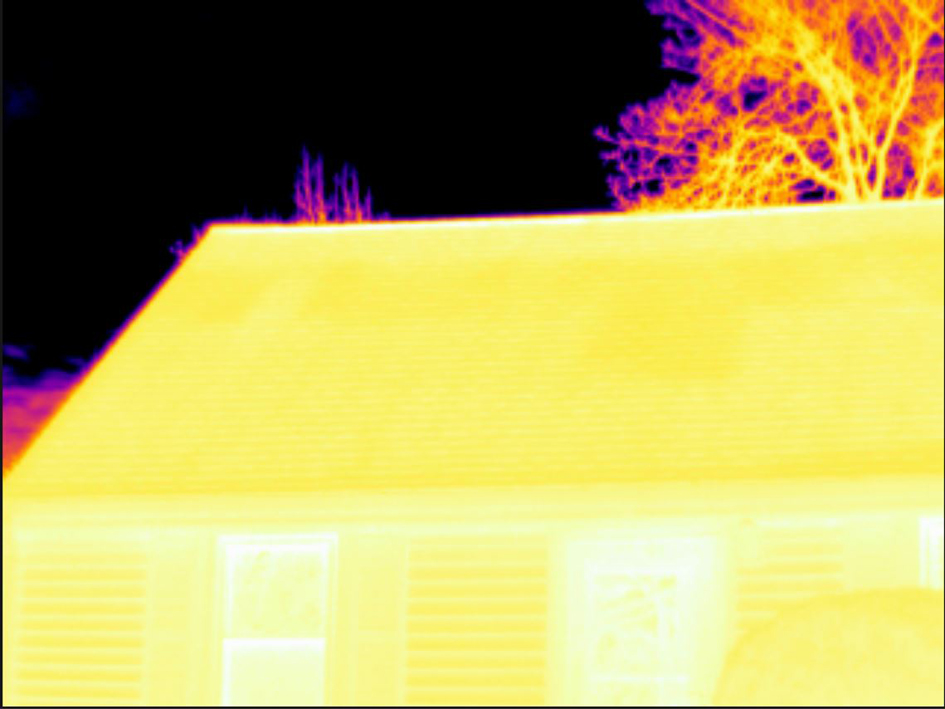
Automatic
|
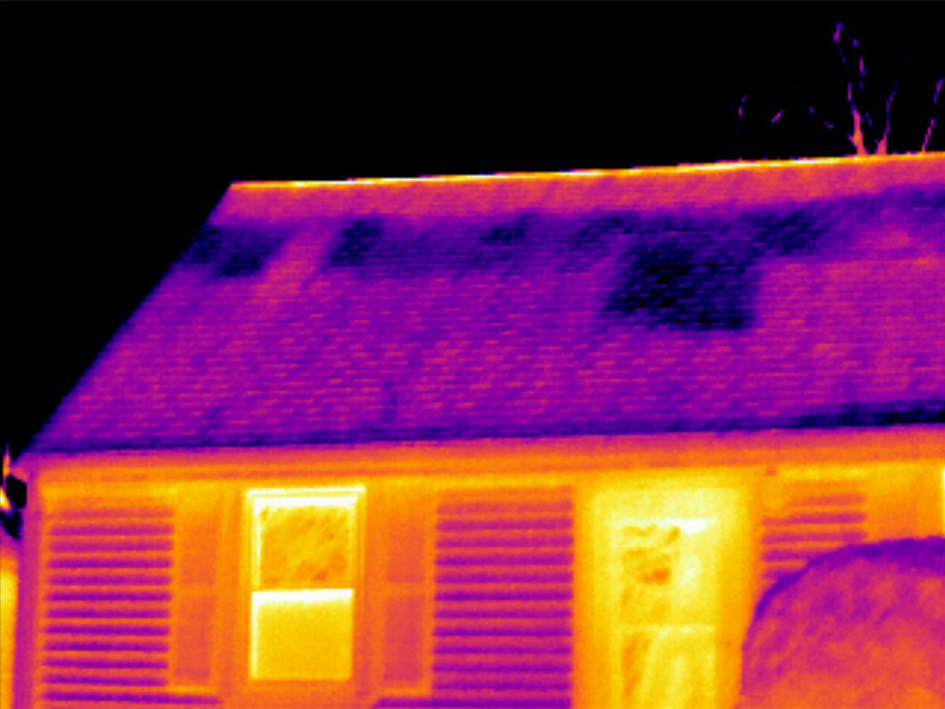
Manual
|
11.6.3 Example 2
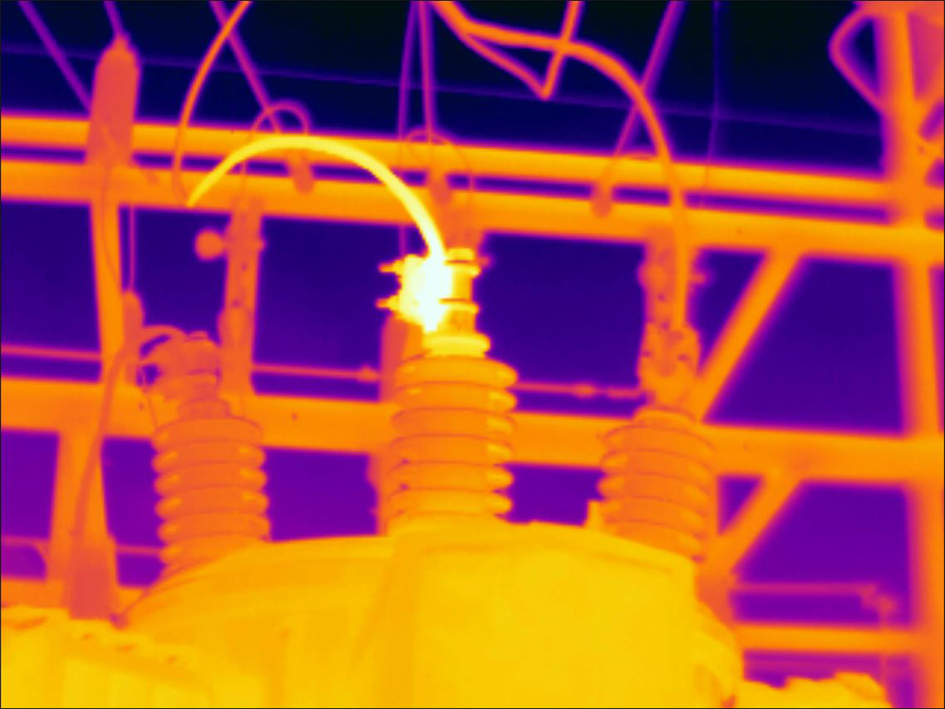
Automatic
|
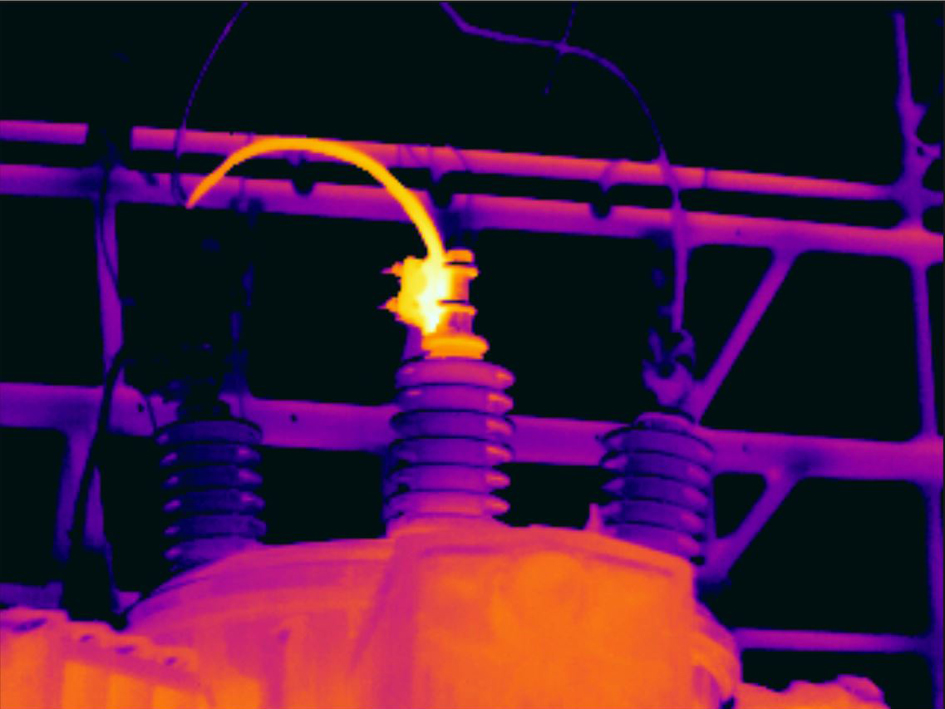
Manual
|
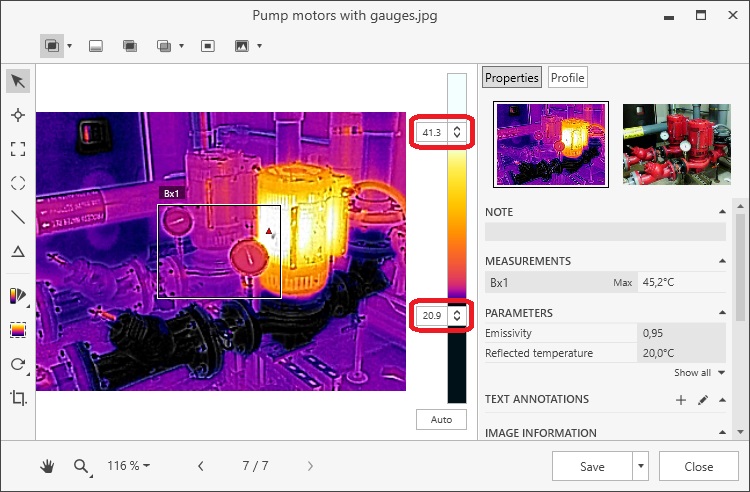
11.6.4 Changing the temperature levels
Follow this procedure:
To change the top level in the temperature scale, drag the top slider up or down.
To change the bottom level in the temperature scale, drag the bottom slider up or down.
11.6.5 Auto-adjusting the image
Follow this procedure:
To auto-adjust the image, click Auto.

11.6.6 Defining an auto-adjust region
Follow this procedure:
On the measurement toolbar, select
(Set auto adjust region).
Use the displayed tool to create a region. This region can be moved and resized to suit your area of interest.
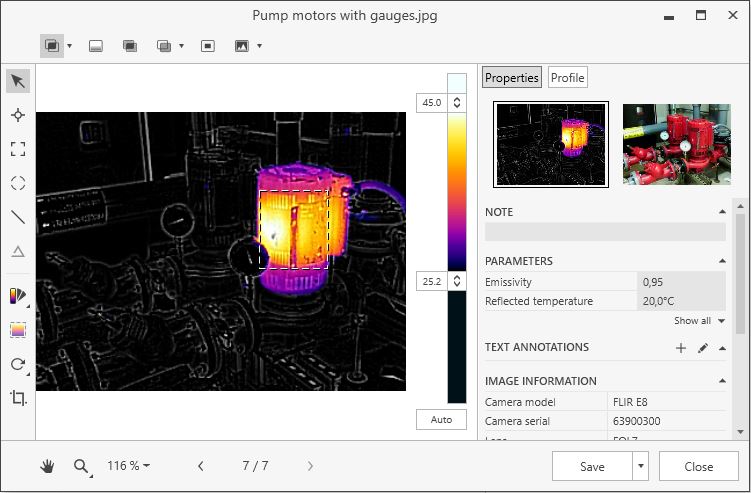
To delete the auto-adjust area, select the region and do one of the following:
- Press the Delete key on your keyboard.
- Right-click the region and select Delete.
11.7 Changing the color distribution
11.7.1 General
11.7.2 Definitions
- Temperature Linear: This is an image-displaying method where the color information in the image is distributed linearly to the temperature values of the pixels.
- Histogram Equalization: This is an image-displaying method that distributes the color information over the existing temperatures of the image. This method of distributing the information can be particularly successful when the image contains few peaks at very high temperature values.
- Signal Linear: This is an image-displaying method where the color information in the image is distributed linearly to the signal values of the pixels.
- Digital Detail Enhancement: This is an image-displaying method where high-frequency content in the image, such as edges and corners, are enhanced to increase the visibility of details.
11.7.3 Procedure
Follow this procedure:
Right-click the image and select Color distribution. This displays a menu.
On the menu, select one of the following:
- Temperature Linear.
- Histogram Equalization.
- Signal Linear.
- Digital Detail Enhancement.
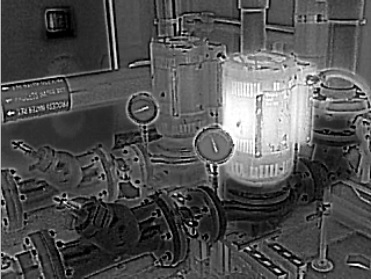
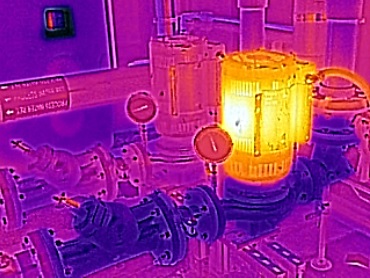
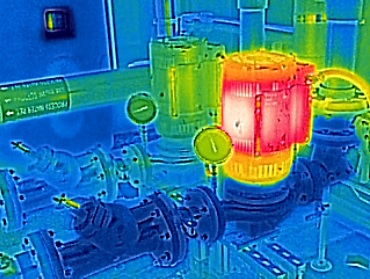
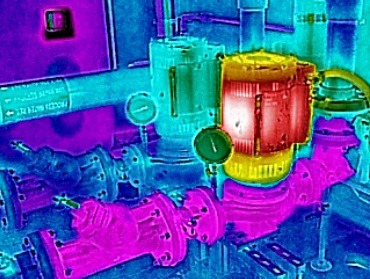
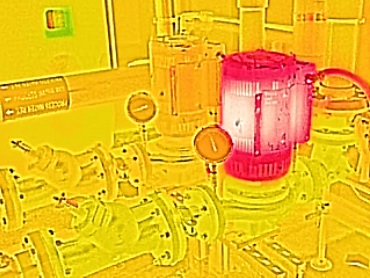
11.8 Changing the color palette
11.8.1 General
|
Color palette |
Image example |
|---|---|
|
Artic
|
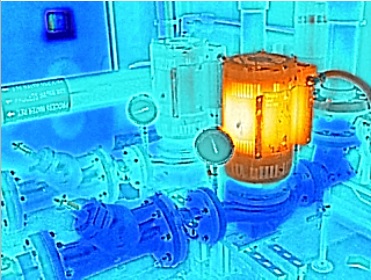
|
|
Cool
|
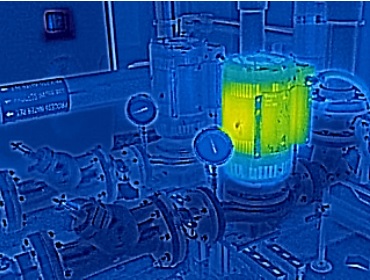
|
|
Gray
|
|
|
Iron
|
|
|
Lava
|

|
|
Rainbow
|
|
|
Rainbow HC
|
|
|
Warm
|
|
11.8.2 Procedure
Follow this procedure:
On the measurement toolbar, select
(Color). This displays a menu.
On the menu, click the palette you want to use.
11.9 Changing the image modes
11.9.1 General
11.9.2 Types of image modes
|
Image mode |
Image example |
|---|---|
|
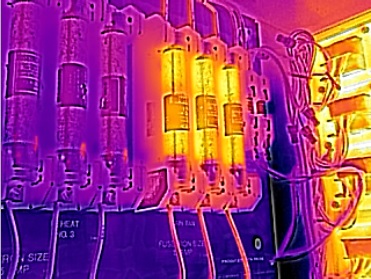
Thermal MSX (Multi Spectral Dynamic Imaging): This mode displays an infrared image where the edges of the objects are enhanced. The thermal/photo
balance can be adjusted.
|
|
|
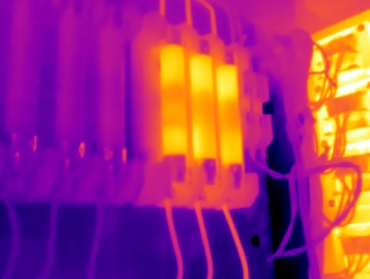
Thermal: This mode displays a fully infrared image.
|
|
|
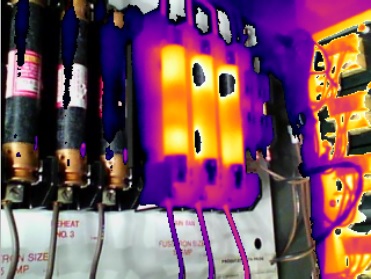
Thermal Fusion: This mode displays a digital photo where some parts are displayed in infrared, depending on the temperature limits.
|
|
|
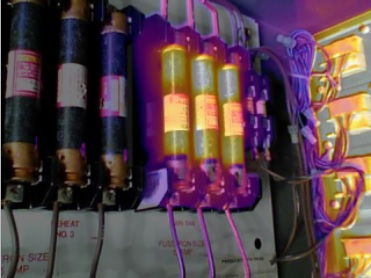
Thermal Blending: The camera displays a blended image that uses a mix of infrared pixels and digital photo pixels. The thermal/photo balance
can be adjusted.
|
|
|
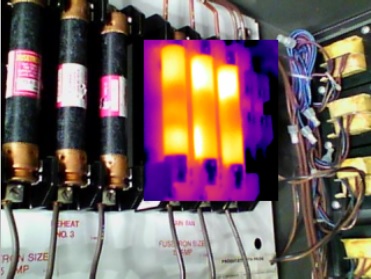
Picture in picture: This mode displays an infrared image frame on top of a digital photo.
|
|
|
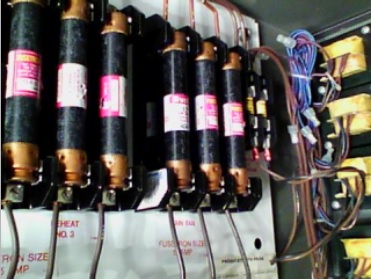
Digital camera: This mode displays a fully digital photo.
|
|
11.9.3 Procedure
Follow this procedure:
On the image mode toolbar, select one of the following:
-
(Thermal MSX).
-
(Thermal).
-
(Thermal Fusion).
-
(Thermal Blending).
-
(Picture in picture).
-
(Digital camera).
Applicable to the Thermal MSX and Thermal Blending modes: To adjust the thermal/photo balance, click the arrow next to the image mode icon and drag the slider left or right.
Applicable to the Digital camera mode: To change the image to grayscale, click the arrow next to the image mode icon and select the check box.
11.10 Working with color alarms and isotherms
11.10.1 General
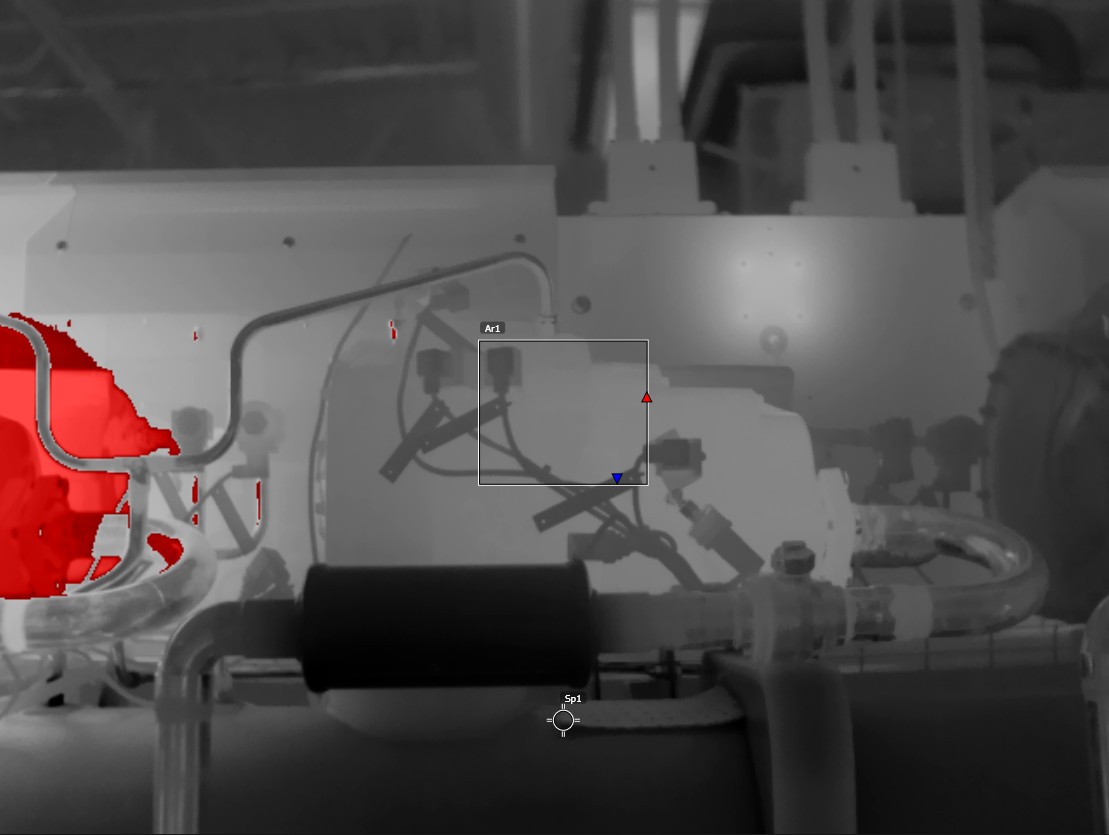
- Above alarm: This will apply a contrasting color to all pixels with a temperature above the specified temperature level.
- Below alarm: This will apply a contrasting color to all pixels with a temperature below the specified temperature level.
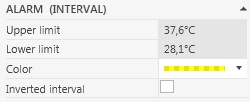
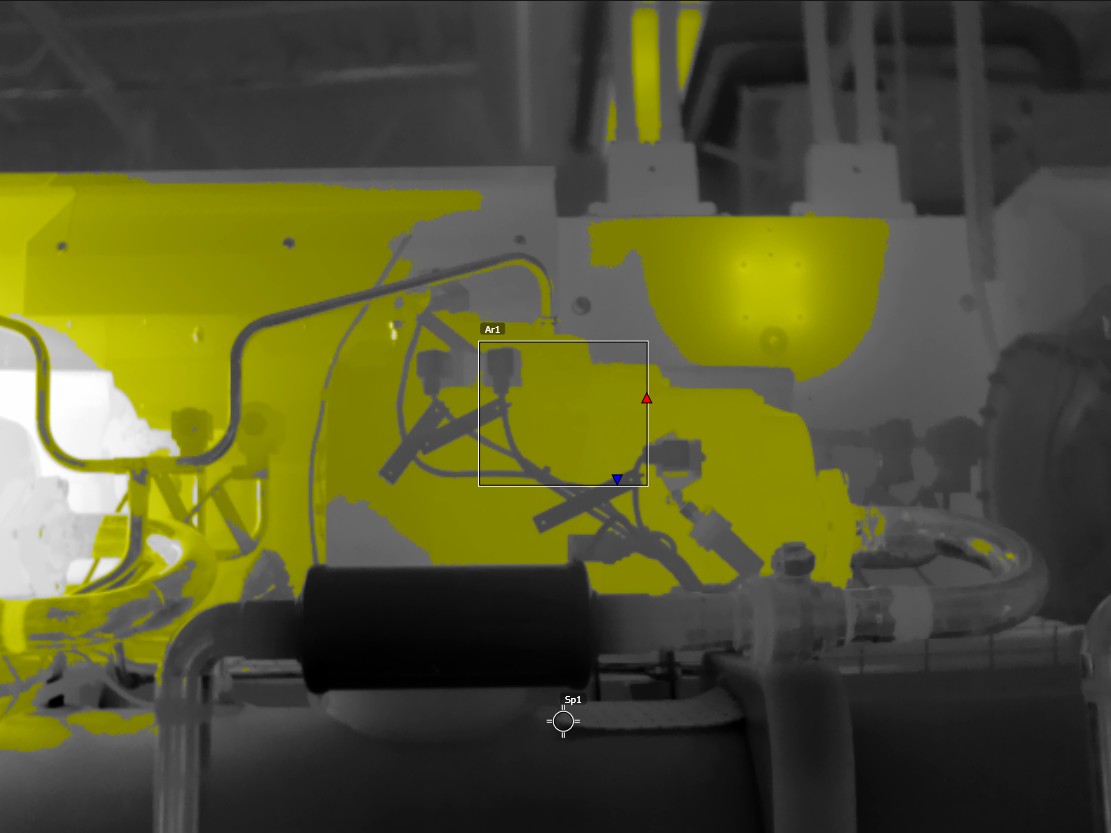
- Interval alarm: This will apply a contrasting color to all pixels with a temperature between two specified temperature levels.
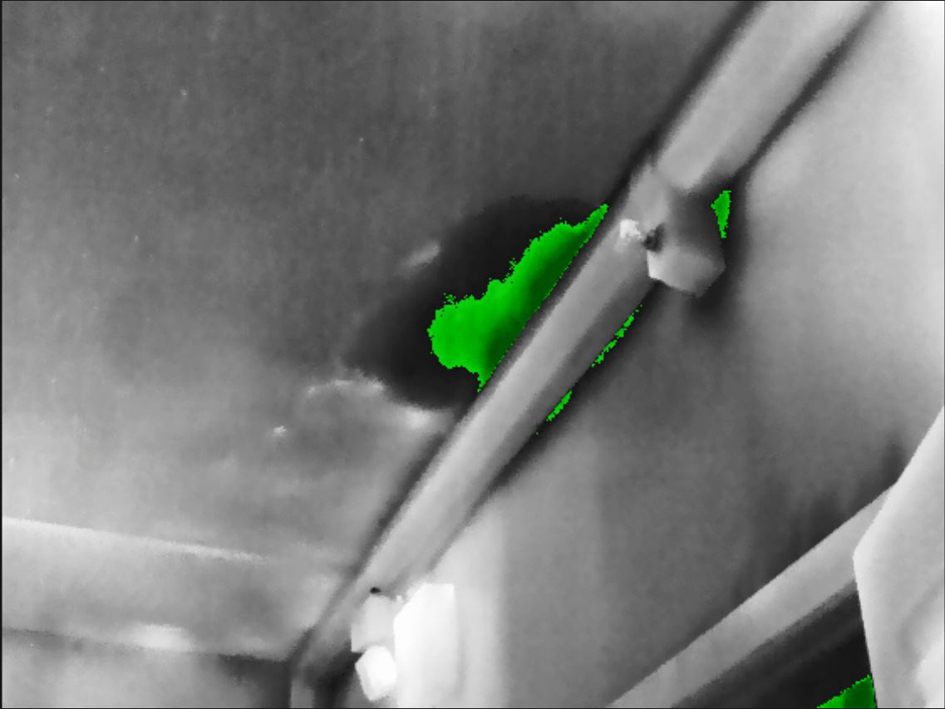
- Humidity alarm: Triggers when a surface where the relative humidity exceeds a preset value is detected.
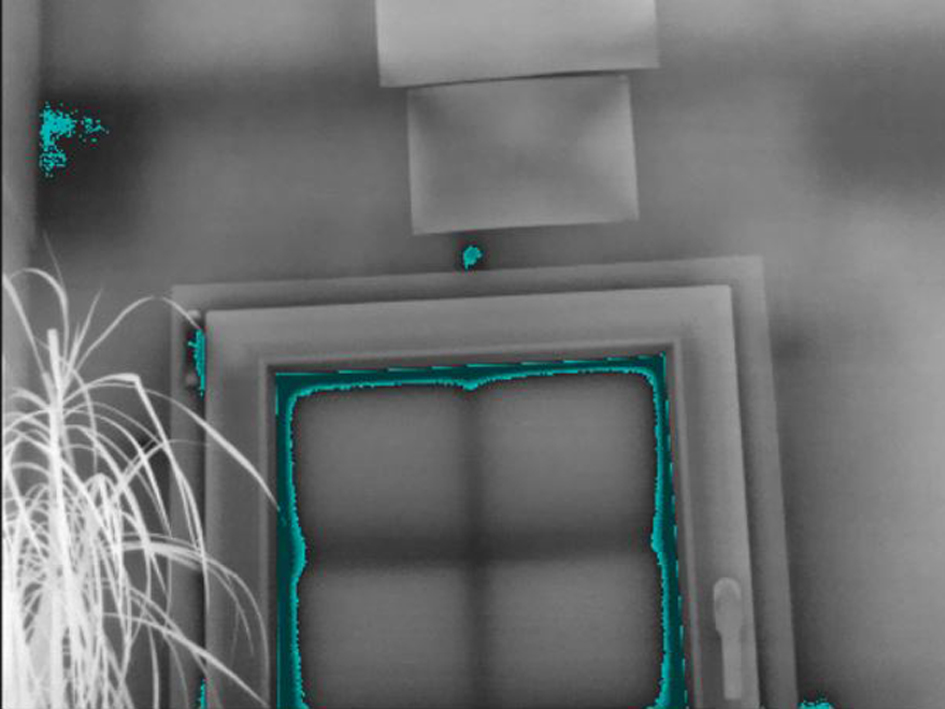
- Insulation alarm: Triggers when there is an insulation deficiency in a wall.
- Custom alarm: This alarm type allows you to manually modify the settings for a standard alarm.
11.10.2 Image examples
|
Color alarm |
Image |
|---|---|
|
Above alarm
|
|
|
Below alarm
|

|
|
Interval alarm
|
|
|
Humidity alarm
|
|
|
Insulation alarm
|
|
11.10.3 Setting up above and below alarms
Follow this procedure:
On the measurement toolbar, select
(Color). This displays a menu.
On the menu, select one of the following:
- Above alarm.
- Below alarm.
In the right pane, take note of the parameter Limit . Areas in the image with a temperature above or below this temperature will be colorized with the isotherm color. You can change this limit, and also change the isotherm color on the Color menu.
11.10.4 Setting up an interval alarm
Follow this procedure:
On the measurement toolbar, select
(Color). This displays a menu.
On the menu, select Interval alarm.
In the right pane, take note of the parameters Upper limit and Lower limit . Areas in the image with a temperature between these two temperatures will be colorized with the isotherm color. You can change these limits, and also change the isotherm color on the Color menu.
11.10.5 Setting up a humidity alarm
11.10.5.1 General
11.10.5.2 Procedure
Follow this procedure:
On the measurement toolbar, select
(Color). This displays a menu.
On the menu, select Humidity alarm. Depending on your object, certain areas will now be colorized with an isotherm color.
In the right pane, take note of the parameter Calculated limit . This is the temperature at which there is a risk of humidity. If the parameter Relative humidity limit is set to 100%, this is also the dew point, i.e., the temperature at which the humidity falls out as liquid water.
11.10.6 Setting up an insulation alarm
11.10.6.1 General
11.10.6.2 Procedure
Follow this procedure:
On the measurement toolbar, select
(Color). This displays a menu.
On the menu, select Insulation alarm. Depending on your object, certain areas will now be colorized with an isotherm color.
In the right pane, take note of the parameter Calculated insulation . This is the temperature where the insulation level falls below a preset value of the energy leakage through the building structure.
11.10.7 Setting up a custom alarm
11.10.7.1 General
- Above alarm.
- Below alarm.
- Interval alarm.
- Humidity alarm.
- Insulation alarm.
- Background .
- Colors (semi-transparent or solid colors).
- Inverted color (for the Interval isotherm only).
11.10.7.2 Procedure
Follow this procedure:
On the measurement toolbar, select
(Color). This displays a menu.
On the menu, select Custom alarm.
In the right pane, specify the following parameters:
-
For
Above
and
Below
:
- Background .
- Limit .
- Color .
-
For
Interval
:
- Background .
- Upper limit .
- Lower limit .
- Color .
- Inverted interval .
-
For
Humidity
:
- Background .
- Relative humidity .
- Relative humidity limit .
- Atmospheric temperature .
- Color .
-
For
Insulation
:
- Background .
- Indoor temperature .
- Outdoor temperature .
- Insulation factor (0–1).
- Color .
11.11 Changing the local parameters for a measurement tool
11.11.1 General
-
In the image, an asterisk (*) is displayed next to the measurement tool.
-
In the result table of the Image Editor, an icon is displayed next to the measurement value.
-
In result fields and tables in infrared reports, an asterisk (*) is displayed and the local parameter values are included
in brackets.
11.11.2 Procedure
Follow this procedure:
On the measurement toolbar, select
(Selection).
Right-click the tool and select Local parameters.
In the dialog box, select Use local parameters.
Enter a value for one or more parameters.
Click OK.
11.12 Working with annotations
11.12.1 General
11.12.2 About image descriptions
11.12.2.1 What is an image description?
11.12.2.1.1 Procedure
- In the right pane, type the image description in the field under NOTE.
11.12.3 About text annotations
11.12.3.1 What is a text annotation?
11.12.3.2 Creating a text annotation for an image
Follow this procedure:
Under TEXT ANNOTATIONS in the right pane, do one of the following:
-
Click
. This opens the Text annotations dialog box.
Enter the desired labels and values. See the image below for examples.


