12 Working in the Microsoft Word environment
12.1 FLIR Word Add-in screen elements
12.1.1 FLIR tab

- Click New Report to create a new report. This starts the FLIR Report Studio wizard. For more information, see section 9 Creating infrared reports .
- Click Thermal image to insert a thermal image object. A thermal image object is a placeholder that automatically loads a thermal image when a report is created. For more information, see section 12.2.2 Inserting a thermal image object .
- Click Digital image to insert a digital image object. A digital image object is a placeholder for the visual image associated with a thermal image. For more information, see section 12.2.3 Inserting a digital image object .
- Click Profile to insert a profile object. A profile object displays a profile plot for a line tool added to the associated thermal image. For more information, see section 12.2.4 Inserting a profile object .
- Click Field to insert a field object. A field object is a placeholder that automatically displays information associated with a thermal image when a report is created. For more information, see section 12.2.5 Inserting a field object .
- Click Table to insert a table object. A table object is a placeholder that automatically displays a table with certain information associated with a thermal image when a report is created. For more information, see section 12.2.6 Inserting a table object .
- Click Report properties to insert a report properties object. A report properties object is a placeholder that automatically displays customer information and information about the inspection when a report is created. For more information, see section 12.2.7 Inserting a report properties object .
- Select a thermal image and click Image Editor to edit the image. This starts the FLIR Report Studio Image Editor. For more information, see section 11 Analyzing and editing images .
-
Click the Create new template arrow and then do one of the following:
- Click Create new template to create a new report template by customizing a basic report template.
- Click Create from existing template to create a new report template by modifying an existing report template.
For more information, see section 13 Creating report templates . - Click the Settings arrow to display the Settings menu. For more information, see section 12.1.2 Settings menu .
-
In the Export group, click the arrow and then do one of the following:
- Click Flat DocX to export the report as a flat report. A flat report can still be edited using ordinary Microsoft Word features, but it is no longer possible to manage the image, field, and table objects.
- Click PDF to export the report as a non-editable PDF report.
For more information, see section 12.7 Exporting a report . - Click Formula manager to create a formula for advanced calculations on items in an infrared image. For more information, see section 12.4 Working with formulas .
- (Available if you have not yet activated your FLIR Report Studio license.) Click to open the activation dialog box. For more information, see section 6 Managing licenses .
12.1.2 Settings menu
- Update page numbers. Click to update the page numbers for fields related to images.
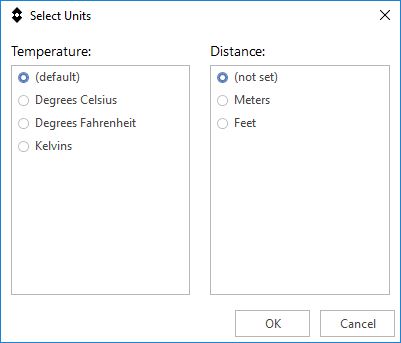
- Set units. Click to set the preferred temperature and distance units. For more information, see section 12.9 Changing the settings .
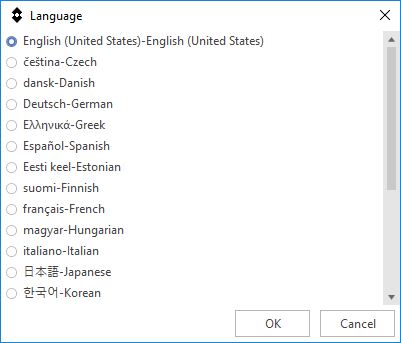
- Select language. Click to select the language. For more information, see section 12.9 Changing the settings .
- Template categories. (Available when creating a report template.) Click to select a category for the report template. For more information, see section 13.2.5 Selecting a template category .
- Help. Click to display the Help menu, see section 12.1.2.1 Help menu .
12.1.2.1 Help menu
- Documentation. Click and select Online to view the latest help files from the internet or Offline to view the help files that are installed on your computer.
- FLIR Store. Click to go to the FLIR Store website.
- FLIR support Center. Click to go to the FLIR Support Center.
- License information. Click to display the License Viewer.
- Check for updates. Click to check for software updates. For more information, see section 15 Software update .
- About. Click to display the current version of the FLIR Word Add-in.
12.2 Managing objects in the report
12.2.1 General
12.2.2 Inserting a thermal image object
Follow this procedure:
Place the pointer where you want the thermal image to appear in the report.
On the FLIR tab, click Thermal image. This displays a thermal image placeholder on the page.

If you are modifying a report, you can open a thermal image in the placeholder. See section 12.2.9 Replacing an image .
If you are creating a report template, you can leave the placeholder as is, without opening any image.
12.2.3 Inserting a digital image object
Follow this procedure:
Place the pointer where you want the digital image to appear in the report.
On the FLIR tab, click Digital image.
If there is more than one thermal image in the report, the Choose Reference dialog box is displayed. Click the thermal image that the digital image you want to insert is associated with and click OK.
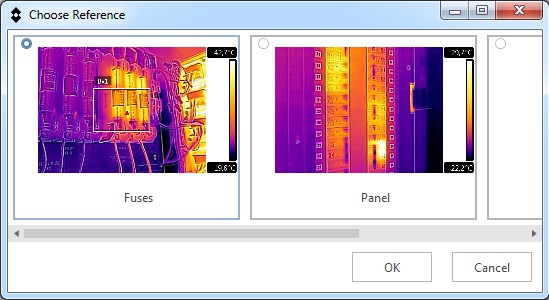
If there is only one thermal image in the report, the associated digital image will be inserted automatically.
A digital image placeholder is displayed on the page. The placeholder number refers to the associated thermal image.

12.2.4 Inserting a profile object
12.2.4.1 General
12.2.4.2 Procedure
Follow this procedure:
Place the pointer where you want the profile object to appear in the report.
On the FLIR tab, click Profile.
If there is more than one image in the report, the Choose Reference dialog box is displayed. Click the image you want to use as the reference for the profile object, and click OK.

If there is only one image in the report, the field object will automatically be connected to that image.
If you are creating a report template, the profile object placeholder is displayed.
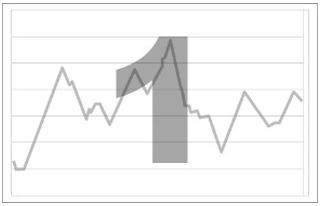
If you are modifying a report and no line tool has been added to the image, an empty profile object is displayed. Double-click the profile object to start the Image Editor and add one or several line tools to the image, see section 11.5.2 Adding a measurement tool .
If you are modifying a report and a line tool is already added to the image, the profile object with the plot is displayed.
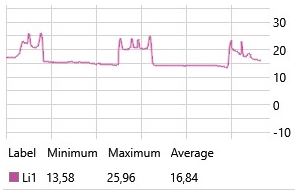
To modify the profile object settings, do the following:
- Right-click the profile object and select Profile settings.
-
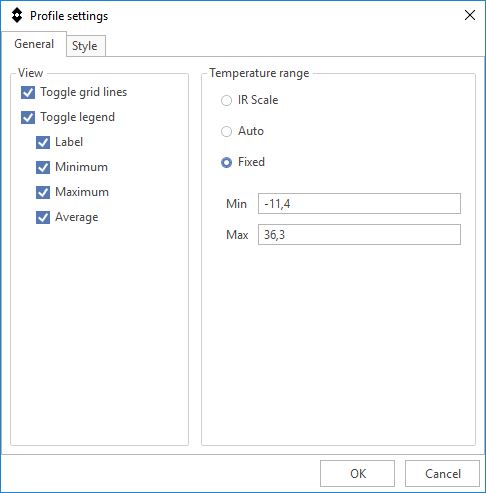
In the General tab, you can select view settings and the following types of temperature scales for the plot:
- IR Scale: Uses the same temperature scale as in the image.
- Auto: Uses the minimum and maximum measured temperatures of the line as the minimum and maximum values for the temperature scale.
- Fixed: Uses manually entered minimum and maximum values for the temperature scale.
-
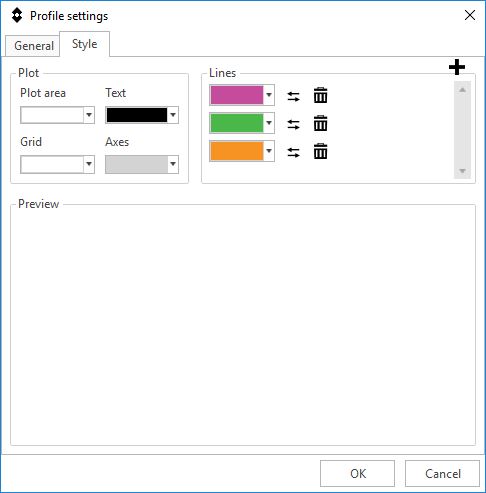
In the Style tab, you can select plot, grid, and line settings.
12.2.5 Inserting a field object
12.2.5.1 General
12.2.5.2 Procedure
Follow this procedure:
Place the pointer where you want the field object to appear in the report.
On the FLIR tab, click Field.
If there is more than one image in the report, the Choose Reference dialog box is displayed. Click the image you want to use as the reference when populating the field object, and click OK.

If there is only one image in the report, the field object will automatically be connected to that image.
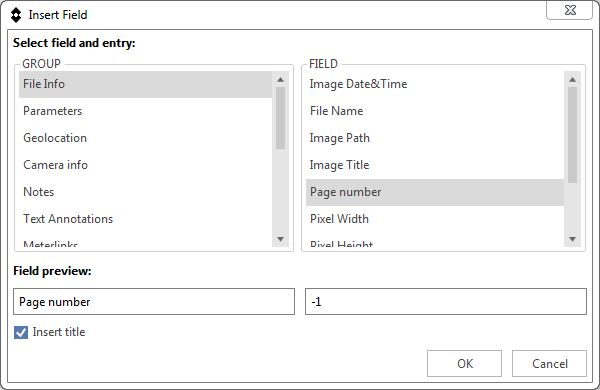
The Insert Field dialog box is displayed.
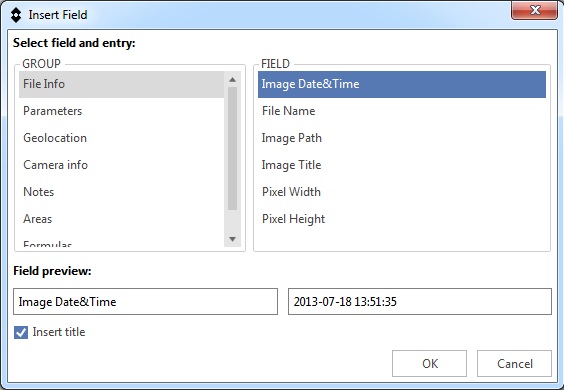
Use the GROUP and FIELD panes to select the content you want the field object to display. A preview of the field object (label and value) is displayed in the dialog box.
Do one of the following:
- Select the Insert title check box to display the label and the value in the report.
- Clear the Insert title check box to display only the value in the report.
Click OK.
The field object with the content you have selected is displayed in the report.
12.2.6 Inserting a table object
12.2.6.1 General
- Measurements.
- Parameters.
- METERLiNK.
- Geolocation.
- Camera Info.
- File Info.
- Text Annotations.
- Notes.
- Formulas.
12.2.6.2 Inserting a table object
Follow this procedure:
Place the pointer where you want the table object to appear in the report.
On the FLIR tab, click Table.
If there is more than one image in the report, the Choose Reference dialog box is displayed. Click the image you want to use as the reference when populating the table object, and click OK.

If there is only one image in the report, the table object will automatically be connected to that image.
The Insert Table dialog box is displayed.
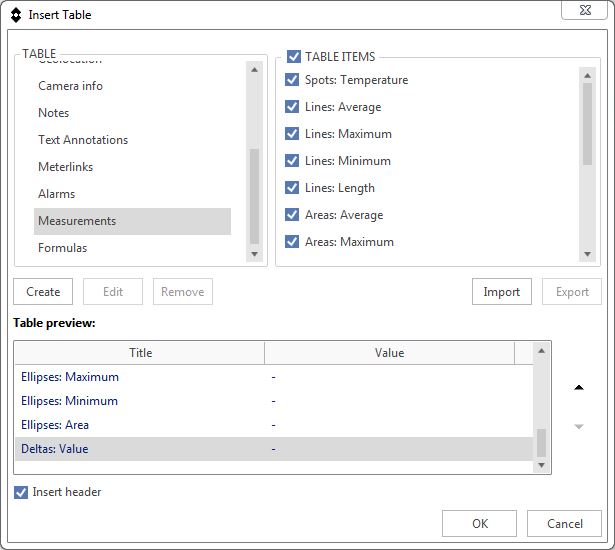
Use the TABLE and TABLE ITEMS panes to select the content you want the table object to display.
A structural preview of the table is displayed in the dialog box. To change the order of the table items, click a row in the
preview and then click the arrow button
or
.
Do one of the following:
- Select the Insert header check box to display the table with a header in the report.
- Clear the Insert header check box to display the table without a header in the report.
Click OK.
The table object with the content you have selected is displayed in the report.
12.2.6.3 Creating a custom table object
Follow this procedure:
Place the pointer where you want the table object to appear in the report.
On the FLIR tab, click Table.
If there is more than one image in the report, the Choose Reference dialog box is displayed. Click the image you want to use as the reference when populating the table object, and click OK.

If there is only one image in the report, the table object will automatically be connected to that image.
The Insert Table dialog box is displayed.

Click the Create button.
The Add/EditTable dialog box is displayed.
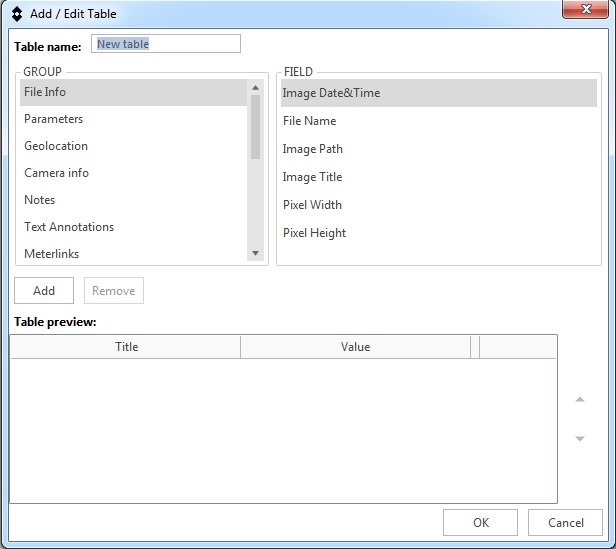
In the Table name text box, enter the name of your table.
Use the GROUP and FIELD panes to select the content you want to display. To include an item in the table, do one of the following:
- Click the item in the FIELD pane and then click the Add button.
- Double-click the item in the FIELD pane.
-
Hover over the item in the FIELD pane and then click the displayed
button.
A structural preview of the table is displayed in the dialog box. To change the order of the table items, click a row in the
preview and then click the arrow button
or
.
To remove a table item, do one of the following:
- Click the row in the preview and then click the Remove button.
-
Hover over the item in the preview and then click the displayed
button.
Click OK.
The Insert Table dialog box is displayed. In the TABLE pane, your table is displayed under Custom.
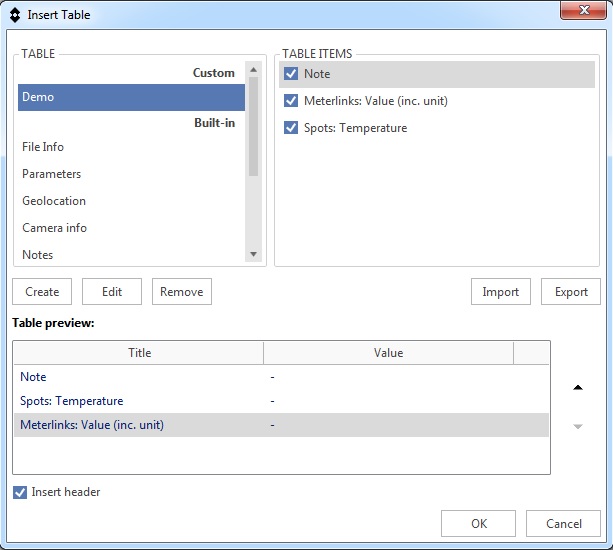
In the Insert Table dialog box, you can do the following:
- To edit a custom table, click the table in the TABLE pane and then click the Edit button.
- To delete a custom table, click the table in the TABLE pane and then click the Remove button.
- To import a custom table, click the Import button.
- To export a custom table, click the table in the TABLE pane and then click the Export button.
Do one of the following:
- Select the Insert header check box to display the table with a header in the report.
- Clear the Insert header check box to display the table without a header in the report.
Click OK.
The table object with the content you have selected is displayed in the report.
12.2.6.4 Inserting a summary table
Follow this procedure:
Place the pointer where you want the summary table to appear in the report.
On the FLIR tab, click the Table arrow. This displays a menu.
On the menu, click Summary table.
The Choose Summary Fields dialog box is displayed.
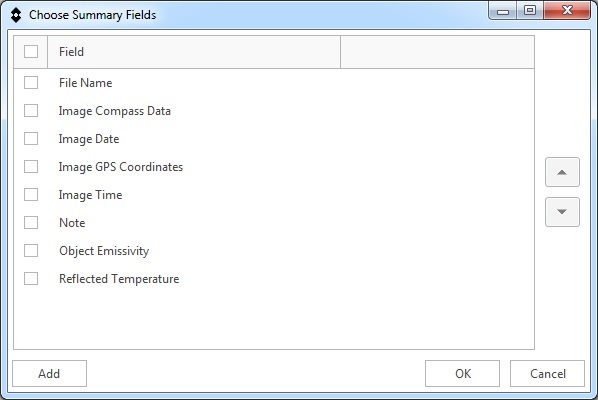
In the Choose Summary Fields dialog box, the displayed Fields are the ones that are available in the report as field objects or items in a table object. To add other field objects, click Add. This displays the Insert Field dialog box.
You can, for example, add the Page number field object, which will show the page where the data is displayed in the report. To do this, select File Info in the GROUP pane, select Page number in the FIELD pane and click OK.
In the Choose Summary Fields dialog box, select the labels you want the summary table object to display.
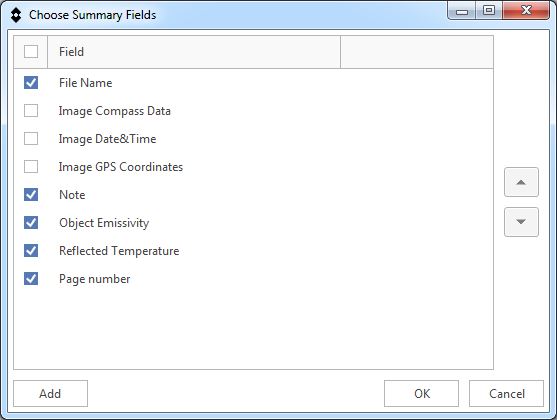
To change the order of the table items, click a row and then click the arrow button
or
.
Click OK.
The summary table object with the content you have selected is displayed in the report.
12.2.7 Inserting a report properties object
Follow this procedure:
Place the pointer where you want the report properties object to appear in the report.
On the FLIR tab, click Report Properties.
The Insert Report Properties dialog box is displayed.
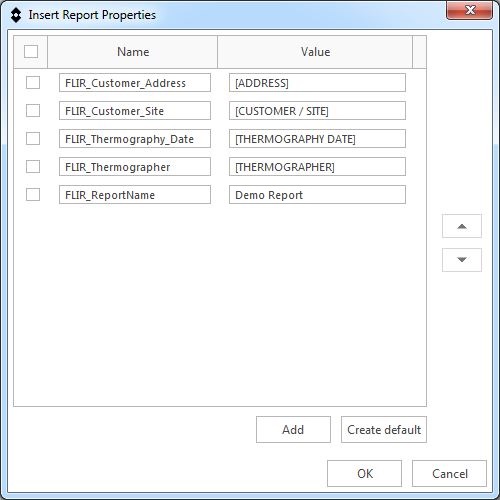
In the Insert Report Properties dialog box, you can do the following:
- To select the items you want the report properties object to display, use the check boxes.
- To change the item name, enter text in the Name text box.
- To change the item value, enter text in the Value text box.
- To add a new table item, click the Add button. Enter text in the Name and Value text boxes.
-
To change the order of the table items, click a row and then click the arrow button
or
.
- To add default table items, click the Create default button.
Click OK.
A table with the content you have selected is displayed in the report.
You can edit the content of the report properties object using ordinary Microsoft Word features.
12.2.8 Resizing objects
12.2.8.1 Resizing an image or profile object
Follow this procedure:
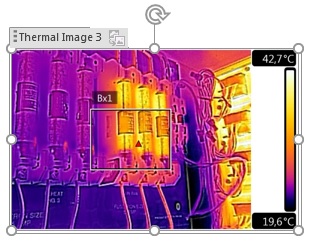
Click an image or profile object on the report page.
Right-click the object and select Resize.
To change the size of the object, drag one of the handles.
12.2.8.2 Resizing a table object
Follow this procedure:
Select a table object on the report page.
On the Table Tools tab, click the Layout tab and use the controls to change the size of the table.
12.2.9 Replacing an image
Follow this procedure:
Right-click an image object and select Replace Image.
In the Open dialog box, locate and open a new image.
12.2.10 Deleting objects
12.2.10.1 Deleting an image or profile object
Follow this procedure:
Click an image or profile object on the report page.
A label is displayed above the image or profile. Click the label to select the entire object.
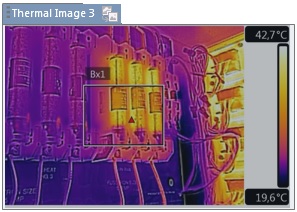
Press the Delete key on your keyboard.
12.2.10.2 Deleting a field object
Follow this procedure:
Click a field object on the report page.
A label is displayed above the object. Click the label to select the entire object.
Press the Delete key on your keyboard.
12.2.10.3 Deleting a table object
Follow this procedure:
Click a table object on the report page.
On the Microsoft Word context-sensitive tab Table Tools, click the Layout tab and then click the Delete button. This displays a menu.
On the menu, click Delete Table.
12.3 Editing an image
Follow this procedure:
To edit an image, do one of the following:
- Click the image. On the FLIR tab, click Image Editor).
- Right-click the image and select Edit Image.
- Double-click the image.
This opens the FLIR Report Studio Image Editor. For more information, see section 11 Analyzing and editing images .
12.4 Working with formulas
12.4.1 General
- A formula can operate only on a single infrared image: it cannot calculate, for example, differences between two infrared images.
- You can use any existing METERLiNK data in the infrared image as a value in a formula, in the same way as you would use an infrared measurement value. METERLiNK data can be stored in the infrared image by using an external FLIR/Extech meter—such as a clamp meter or a moisture meter—together with the infrared camera.
12.4.2 Creating a simple formula
Creating a formula that calculates the temperature difference between two spots
In your report, insert a thermal image object, see section 12.2.2 Inserting a thermal image object .
Open an image in the Image Editor, see section 12.3 Editing an image .
Add two spot tools in the image, see section 11.5.2 Adding a measurement tool .
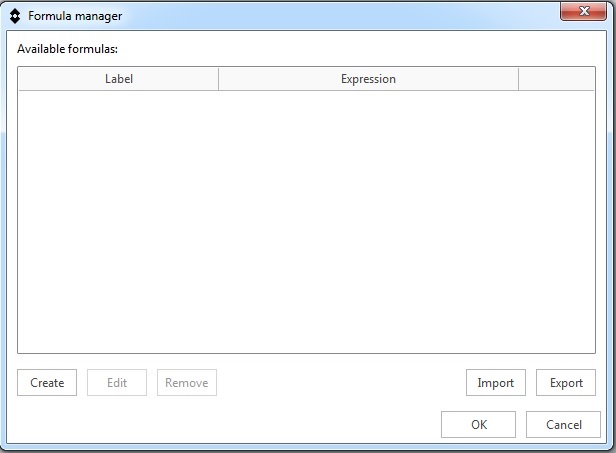
On the FLIR tab, click Formula manager.
The Formula manager dialog box is displayed. Click the Create button.
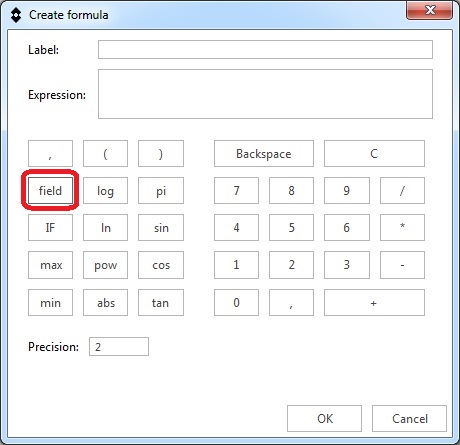
The Create formula dialog box is displayed. Click the field button.
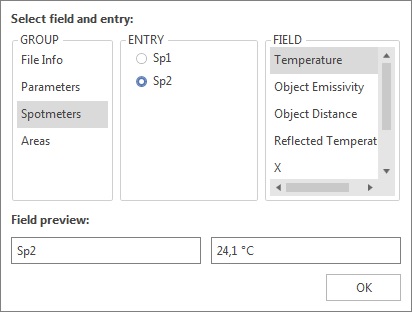
The Select field and entry dialog box is displayed.
Do the following:
- In the GROUP pane, click Spotmeters.
- In the ENTRY pane, click Sp2.
- In the FIELD pane, click Temperature.
- Click OK.
In the Create formula dialog box, click the minus button to add a subtraction mathematical operator.
Click the field button. Repeat step 7 for spot Sp1.
The Create formula dialog box now displays the temperature difference formula using FLIR Systems syntax.
In the Label text box, enter the text you want to be displayed with the formula result in the report. In the Precision box, enter the number of decimal places for the formula result.
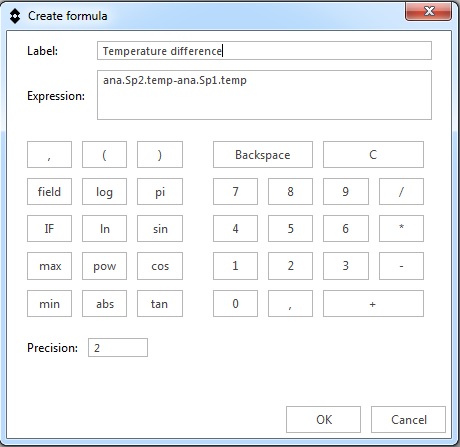
In the Create formula dialog box, click OK.
In the Formula manager dialog box, click OK.
The created temperature difference formula can now be inserted in the field and table objects in the report.
12.4.3 Creating a conditional formula
Creating a conditional formula using the IF statement
Create a formula that calculates the temperature difference between two spots, see section 12.4.2 Creating a simple formula .
On the FLIR tab, click Formula manager.
The Formula manager dialog box is displayed. Click the Create button.
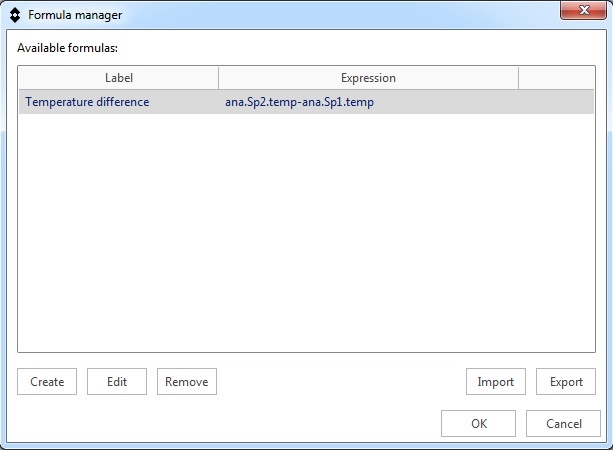
The Create formula dialog box is displayed. Click the IF button.
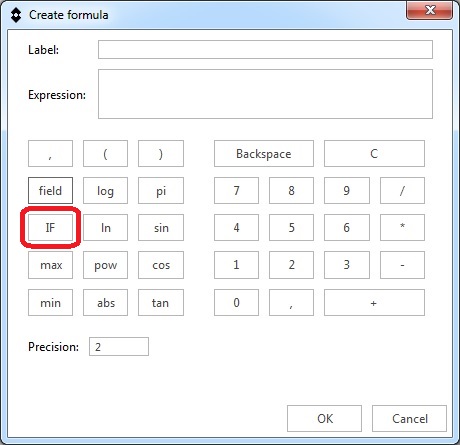
The Create ‘IF’ formula dialog box is displayed. Click the Add... button.
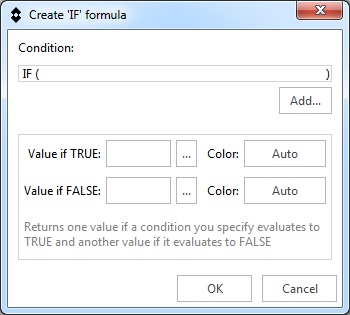
A dialog box is displayed.
Do the following:
- Under Left value, click the ... button. This displays the Select field and entry dialog box. In the GROUP pane, click Formulas. In the FIELD pane, select the temperature difference formula. Click OK.
- In the Operator drop-down list, select >.
- In the Right value text box, enter 2.0.
- Click OK.
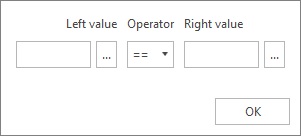
In the Create ‘IF’ formula dialog box, do the following:
- On the Value if TRUE row, click the ... button and select the temperature difference formula.
- On the Value if TRUE row, click the Auto button and select the color red.
- On the Value if FALSE row, click the ... button and select the temperature difference formula.
- On the Value if FALSE row, click the Auto button and select the color green.
- Click OK.
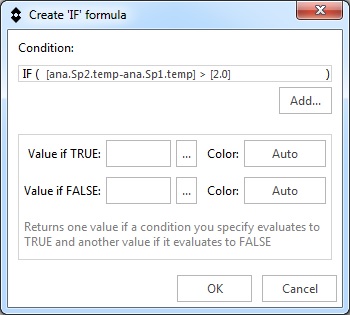
The Create formula dialog box now displays the complete conditional formula. The two 10-digit code strings after the equals sign represent the colors.
In the Label text box, enter the text you want to be displayed with the formula result in the report. In the Precision box, enter the number of decimal places for the formula result.
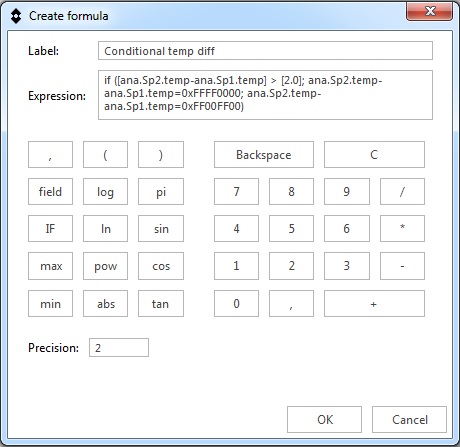
In the Create formula dialog box, click OK.
In the Formula manager dialog box, click OK.
The created conditional formula can now be inserted in the field and table objects in the report. The result of the temperature difference formula will be displayed in red or green, depending on the measured values of the two spotmeters.
12.4.4 Exporting and importing formulas
On the FLIR tab, click Formula manager.
The Formula manager dialog box is displayed.
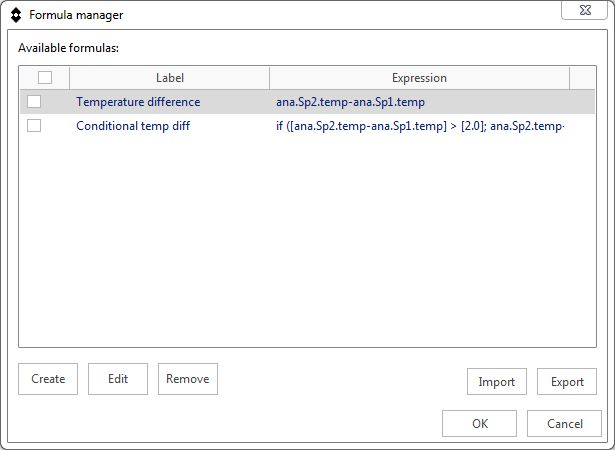
In the Formula manager dialog box, do one of the following:
- To import formula(s) from a text file, click the Import button.
- To export one or more formulas to a text file, select the formulas and click the Export button.
12.5 Document properties
12.5.1 General
12.5.2 Types of document properties
- Summary document properties.
- Custom document properties.
12.5.3 Creating and editing Microsoft Word document properties
Creating and editing document properties
Start the FLIR Report Studio wizard. In the center pane, right-click one of the report templates and select Edit. This opens the report template (*.dotx) in Microsoft Word.
On the File tab, click Info.
From the Properties drop-down menu, select Advanced Properties.
On the Summary tab, enter your information in the appropriate text boxes.
Click the Custom tab.
To add a custom property, type a name in the Name box. To make your custom properties easy to find, you can type an underscore ( _ ) as the first character in the name of the property.
Use the Type box to specify the type of property.
To specify the value of the property, type it in the Value box.
Click Add to add the custom property to the list of properties, and then click OK .
Save the infrared report template using a different filename but with the same filename extension (*.dotx). You have now added summary and custom properties to your renamed infrared report template.
12.6 Creating a report
Follow this procedure:
On the FLIR tab, click New report.
This opens the FLIR Report Studio wizard. For more information, see section 9 Creating infrared reports .
12.7 Exporting a report
- Flat DocX: This exports the report as a flat report with the suffix “_flat”. A flat report can still be edited using ordinary Microsoft Word features, but it is no longer possible to manage the image, field, and table objects.
- PDF: This exports the report as a non-editable PDF report.
Follow this procedure:
On the FLIR tab, in the Export group, click the arrow. This displays a menu.
On the menu, select Flat DocX or PDF.
12.8 Creating a report template
Follow this procedure:
On the FLIR tab, click Create new template.
This opens the FLIR Report Studio Template Editor. For more information, see section 13 Creating report templates .
12.9 Changing the settings
Follow this procedure:
On the FLIR tab, click Settings. This displays a menu.
On the menu, do the following:
-
To change the units, click Set units . This displays a dialog box, where you can set the temperature and distance units. If a unit has not been specified in the
report template, default or not set is marked.
-
To change the language, click Select language. This displays a dialog box, where you can set the language
